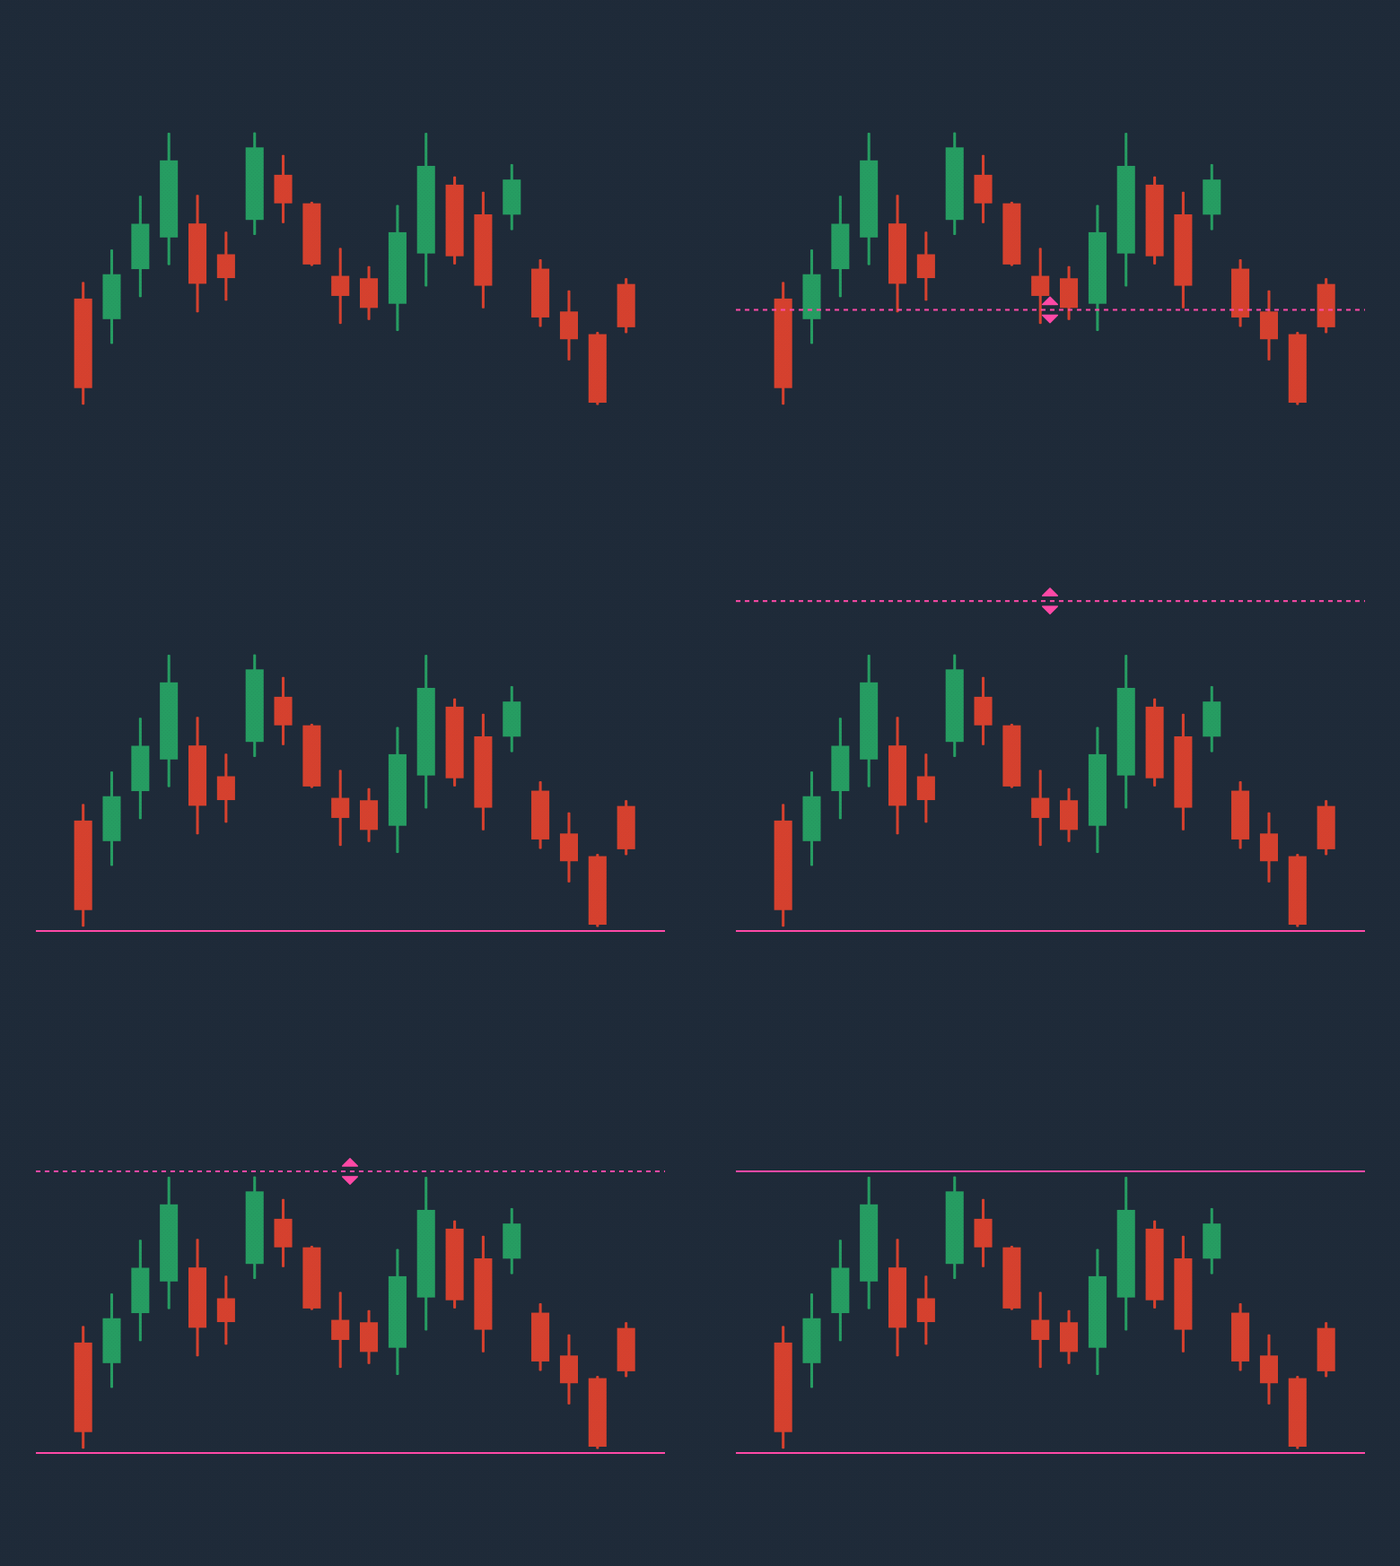
How to Draw Support and Resistance Levels
The support level is drawn on the lowest prices, that is, the lower shadows of the candlesticks.
Choose a few lowest prices and draw a line through them using the horizontal line tool.
The resistance level is drawn on the highest prices, that is, the upper shadows of the candlesticks.
Choose a few highest prices and draw a line through them.

The more lowest and highest prices you use to draw levels, the more accurate they are.
Use timeframes from 1 hour and longer. The older the timeframe, the more accurate the support and resistance levels.