Support and Resistance Level Breakthroughs
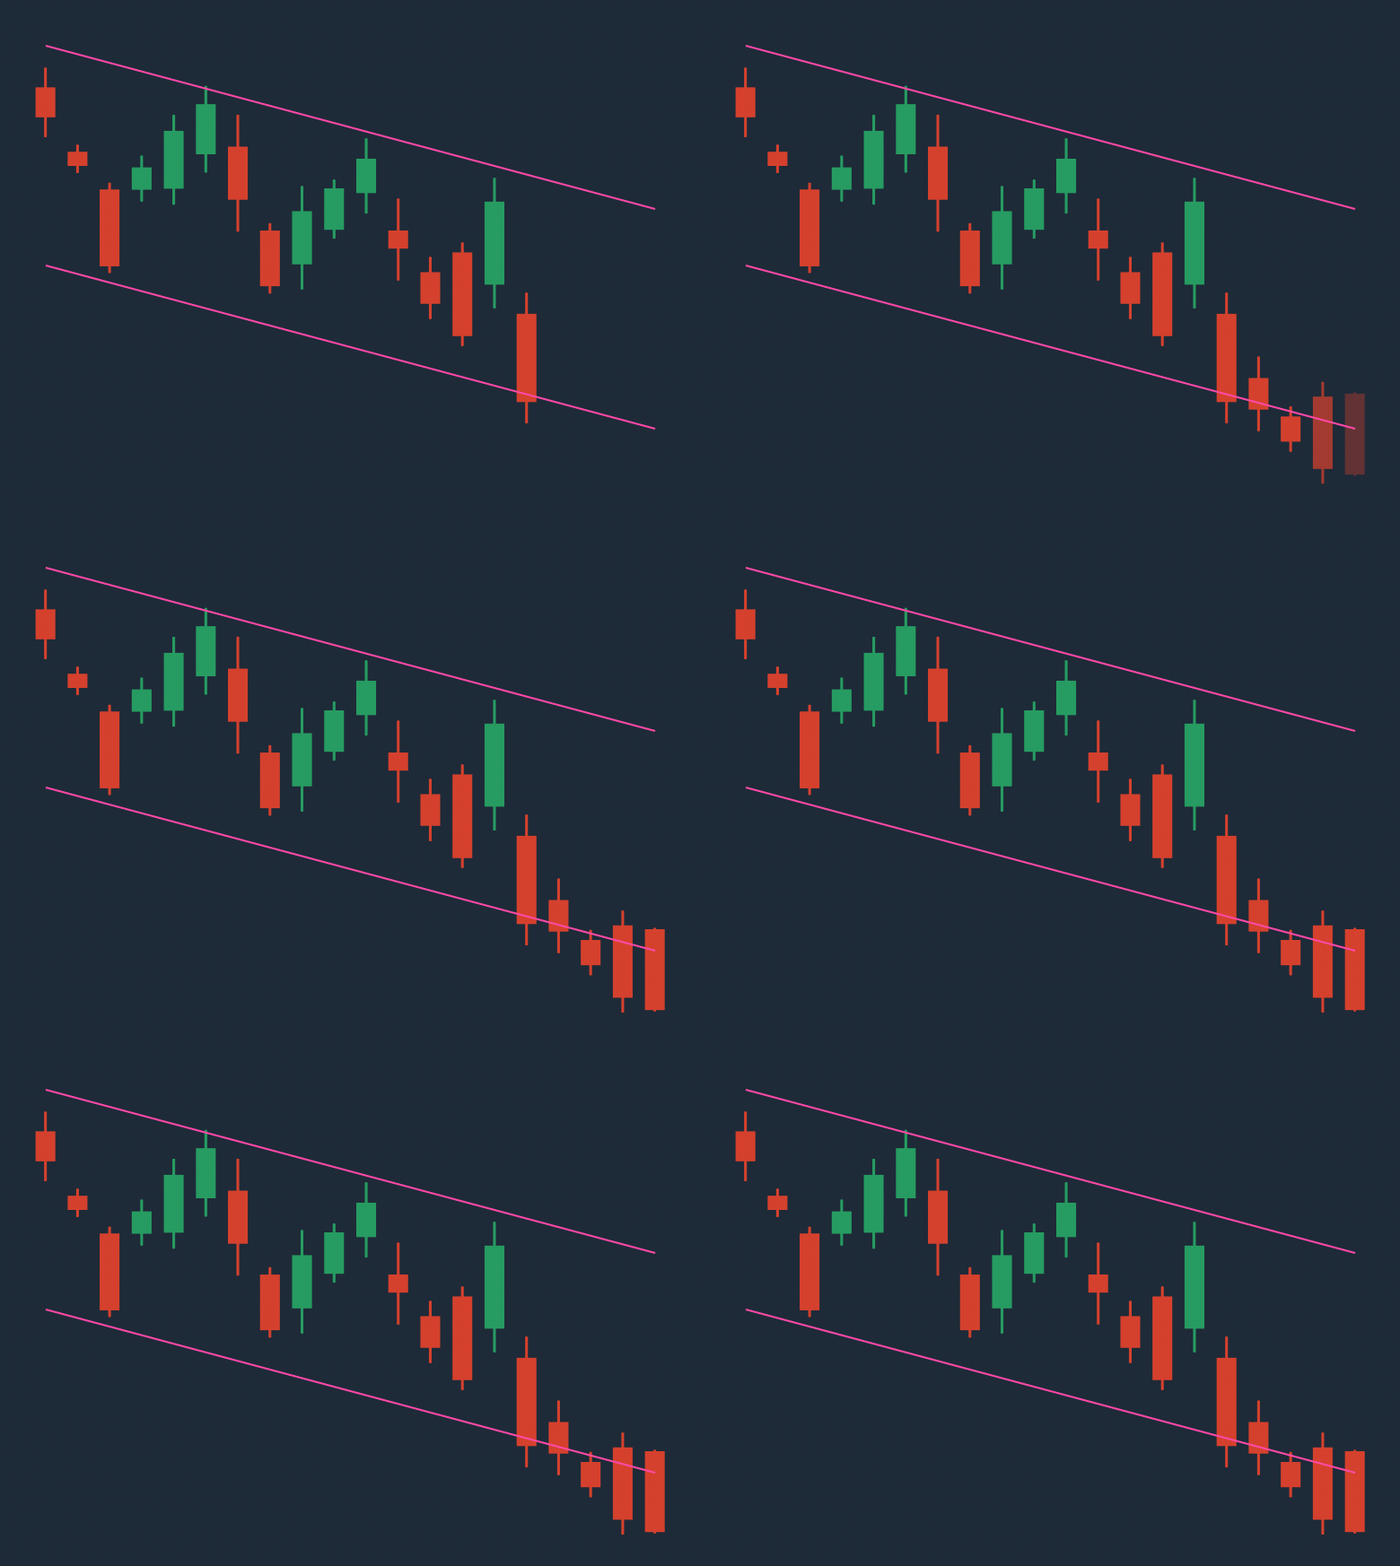
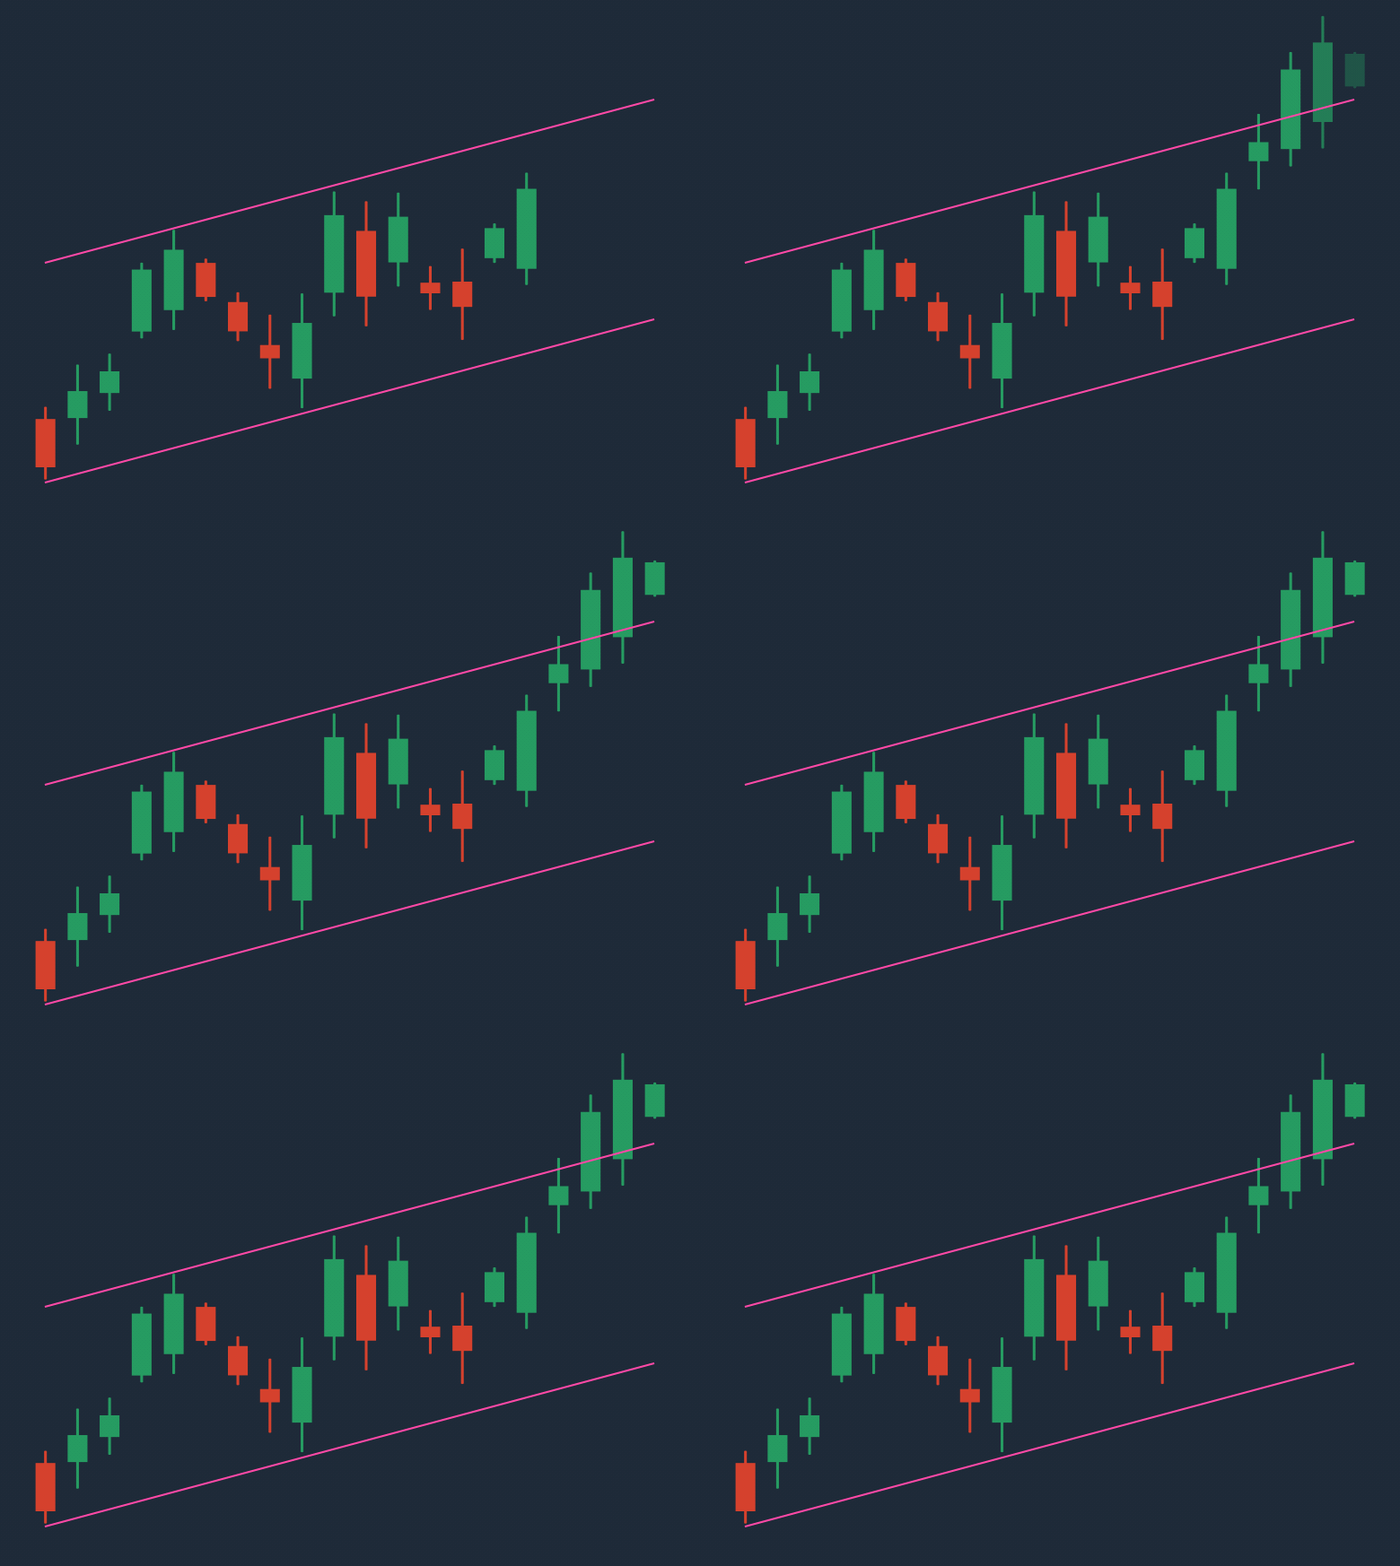
The chart goes beyond the support and resistance levels periodically and breaks through them.
If the price plummets and continues to decline, the support level becomes the resistance level.
This happens when traders begin to sell an asset in high volumes. In this case, its value takes a plunge.

If the asset price spikes and continues to increase, the resistance level becomes a new support level.
The reason for such a breakthrough is a large volume of asset purchases. In this case, its value is rising.
